[Matplotlib.pyplot] 07. Histogram
Updated:
import matplotlib.pyplot as plt
import numpy as np
1. hist
matplotlib에서 히스토그램을 그리기 위해서는 Axes.hist()를 사용해야한다.
Axes.hist(x,bins=None,density=False,cumulative=False,orientation=’vertical’,align=’mid’)
- x: histogram으로 표현할 값
- bins: 간격 수
- density: y축이 갯수가 아닌 probablity density를 표현한다. probability가 아닌 density임에 주의하자! (면적이 1)
- cumulative: 누적 갯수
- orientation: ‘vertical’, ‘horizontal’ 중 선택
- align: ‘left’, ‘mid’, ‘right’ 중 선택
- 그 외 parameter는 api 참고
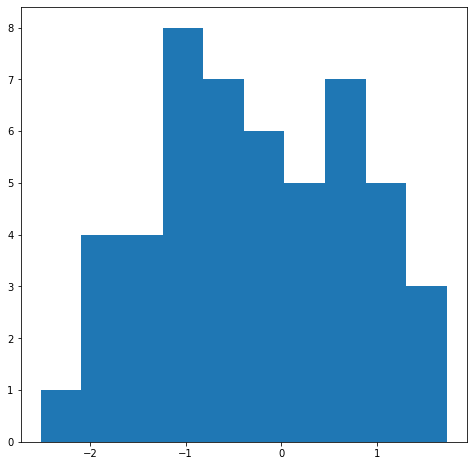
n_data = 50

fig,ax = plt.subplots(figsize=(8,8))

x = np.random.randn(n_data)

ax.hist(x)
(array([1., 4., 4., 8., 7., 6., 5., 7., 5., 3.]),
 array([-2.51332481, -2.08928554, -1.66524627, -1.241207  , -0.81716773,
        -0.39312846,  0.03091081,  0.45495008,  0.87898935,  1.30302862,
         1.72706789]),
 <BarContainer object of 10 artists>)
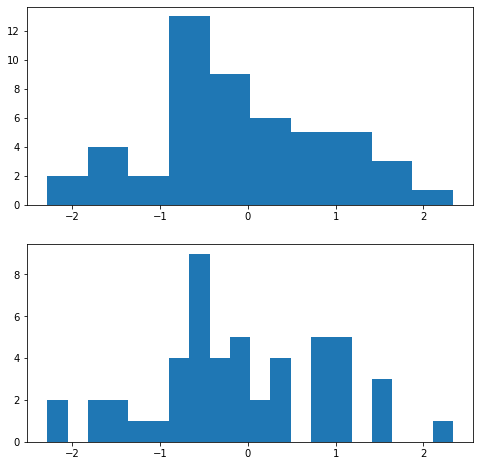
n_data = 50

fig,axes= plt.subplots(2,1,figsize=(8,8))

x = np.random.randn(n_data)

axes[0].hist(x)
axes[1].hist(x,bins=20)
(array([2., 0., 2., 2., 1., 1., 4., 9., 4., 5., 2., 4., 0., 5., 5., 0., 3.,
        0., 0., 1.]),
 array([-2.28411285, -2.05300787, -1.82190289, -1.59079791, -1.35969293,
        -1.12858795, -0.89748298, -0.666378  , -0.43527302, -0.20416804,
         0.02693694,  0.25804192,  0.48914689,  0.72025187,  0.95135685,
         1.18246183,  1.41356681,  1.64467179,  1.87577676,  2.10688174,
         2.33798672]),
 <BarContainer object of 20 artists>)
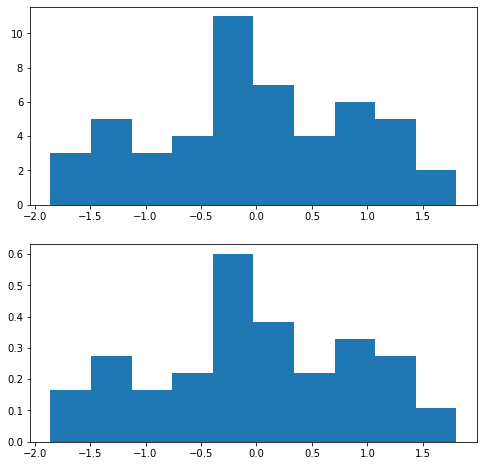
n_data = 50

fig,axes= plt.subplots(2,1,figsize=(8,8))

x = np.random.randn(n_data)

axes[0].hist(x)
axes[1].hist(x,density=True)
(array([0.16399127, 0.27331878, 0.16399127, 0.21865503, 0.60130132,
        0.3826463 , 0.21865503, 0.32798254, 0.27331878, 0.10932751]),
 array([-1.85722033, -1.4913472 , -1.12547406, -0.75960093, -0.39372779,
        -0.02785466,  0.33801848,  0.70389161,  1.06976475,  1.43563788,
         1.80151102]),
 <BarContainer object of 10 artists>)
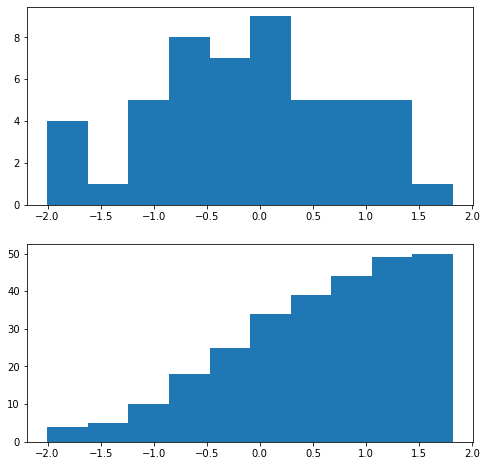
n_data = 50

fig,axes= plt.subplots(2,1,figsize=(8,8))

x = np.random.randn(n_data)

axes[0].hist(x)
axes[1].hist(x,cumulative=True)
(array([ 4.,  5., 10., 18., 25., 34., 39., 44., 49., 50.]),
 array([-2.00284619, -1.62049593, -1.23814567, -0.8557954 , -0.47344514,
        -0.09109488,  0.29125539,  0.67360565,  1.05595591,  1.43830618,
         1.82065644]),
 <BarContainer object of 10 artists>)
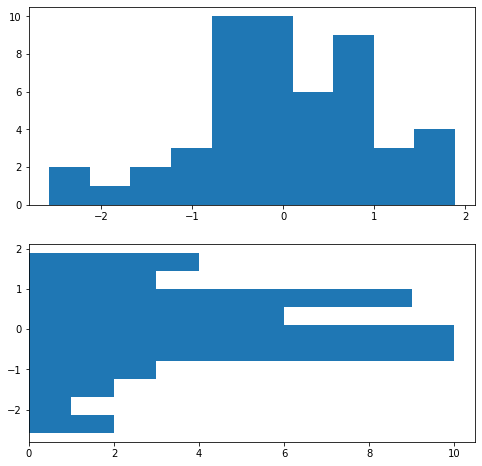
n_data = 50

fig,axes= plt.subplots(2,1,figsize=(8,8))

x = np.random.randn(n_data)

axes[0].hist(x)
axes[1].hist(x,orientation='horizontal')
(array([ 2.,  1.,  2.,  3., 10., 10.,  6.,  9.,  3.,  4.]),
 array([-2.57089357, -2.12521051, -1.67952746, -1.2338444 , -0.78816135,
        -0.34247829,  0.10320476,  0.54888782,  0.99457087,  1.44025393,
         1.88593699]),
 <BarContainer object of 10 artists>)
2. n, bins, patches
Axes.hist()는 다음 3가지를 반환한다.
- n: The value of the histogram bins. 각 막대가 지닌 높이를 담은 array를 반환한다.
- bins: the edge of bins. 즉 Axes.hist() parameter의 bins가 총 10개라면 edge는 11개가 된다.
- patches: Rectangle Object를 담은 Bar Container를 반환한다.
- get_x(), get_width(), get_height()를 사용하여 활용 가능
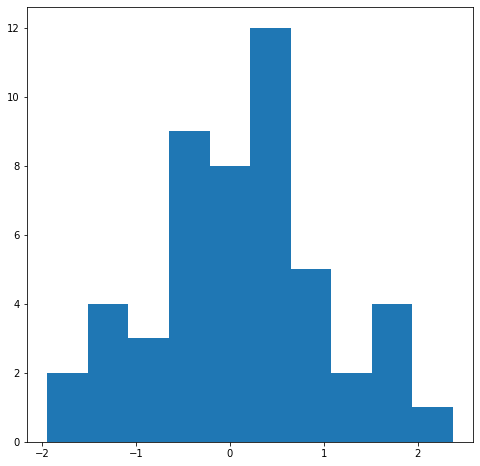
n_data = 50
x = np.random.randn(n_data)

fig,ax = plt.subplots(figsize=(8,8))

# 이름을 바꾸어서 표현
heights, bin_edges, rects = ax.hist(x)
print(heights)
print(bin_edges)
print(rects)
[ 2.  4.  3.  9.  8. 12.  5.  2.  4.  1.]
[-1.94514072 -1.513107   -1.08107328 -0.64903956 -0.21700583  0.21502789
  0.64706161  1.07909533  1.51112906  1.94316278  2.3751965 ]
<BarContainer object of 10 artists>
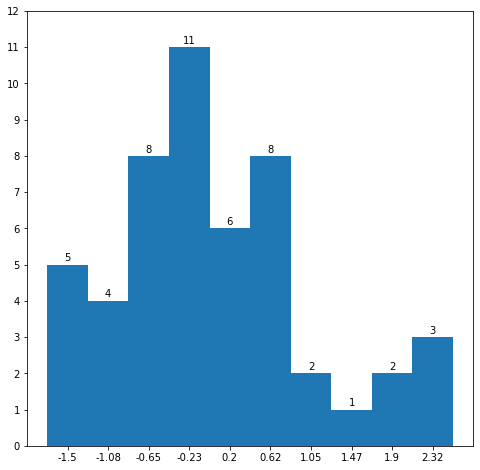
n_data = 50
x = np.random.randn(n_data)

fig,ax = plt.subplots(figsize=(8,8))

# 이름을 바꾸어서 표현
heights, bin_edges, rects = ax.hist(x)

# lims
ymax = max(heights)
ax.set_ylim([0,ymax+1])

# tick
bin_center = (bin_edges[:-1] + bin_edges[1:]) / 2
ax.set_xticks(bin_center)
ax.set_xticklabels(bin_center.round(2))

yticks = np.arange(ymax+2,dtype=np.int8)
ax.set_yticks(yticks)
ax.set_yticklabels(yticks)

for idx in range(len(heights)):
    ax.text(bin_center[idx],heights[idx]+0.1,int(heights[idx]),ha='center')
Leave a comment