[Matplotlib.pyplot] 06. Bar Plot
Updated:
import matplotlib.pyplot as plt
import numpy as np
1. bar
1.1. bar plot
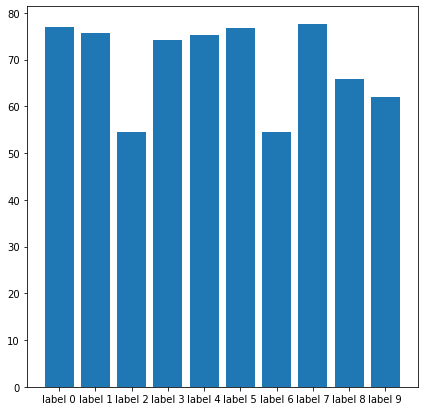
matplotlib에서 막대 그래프를 그리기 위해서는 bar를 이용해야한다.
Axes.bar(x,height,width=0.8,botton=None,align=’center’,tick_label=optional)
- x: bar가 위치할 x 좌표
- height: 막대의 높이
- width: 막대의 폭
- bottom: 막대가 위치할 y좌표
- align: x좌표를 기준으로 bar의 ‘center’가 tick에 위치할 지 bar의 ‘edge’가 tick에 위치할 지 표시
- tick_label: bar plot은 tick label을 parameter로 넣을 수 있다. (개인적으로 앞서 소개한 tick 관련 메소드를 이용하는 것을 추천!)
fig,ax = plt.subplots(figsize=(7,7))

n_data = 10
x = np.arange(n_data)
tick_labels = ['label ' + str(i) for i in range(10)]
bar_data = np.random.uniform(50,80,(n_data,))

# plotting
ax.bar(x,bar_data,tick_label=tick_labels)
<BarContainer object of 10 artists>

1.2. horizontal bar plot
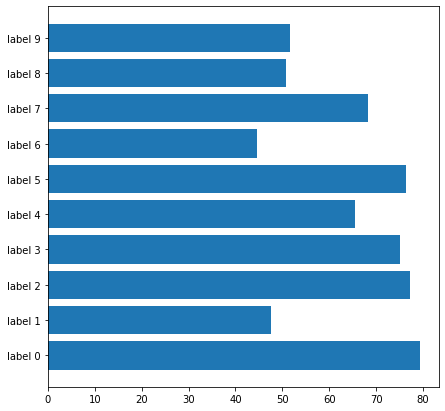
수평 막대 그래프를 그리는데 사용된다.
Axes.barh(y,width,height=0.8,left=None,align=’center’)
- y: 수평 막대 그래프가 위치할 y좌표
- width: 막대가 가지는 값 / 수직 막대 그래프에서 height에 해당한다.
- height: 막대의 폭 / 수직 막대 그래프에서 width에 해당한다.
- left: 수평 막대 그래프가 위치할 x좌표
- align: y좌표를 기준으로 bar의 ‘center’가 tick에 위치할 지 bar의 ‘edge’가 tick에 위치할 지 표시
- 다른 parameter는 api 참고
fig,ax = plt.subplots(figsize=(7,7))

n_data = 10
y = np.arange(n_data)
barh_data = np.random.uniform(40,80,(n_data))

ytick_labels = ['label '+ str(i) for i in range(10)]

ax.set_yticks(y)
ax.set_yticklabels(ytick_labels)

ax.barh(y,barh_data)
<BarContainer object of 10 artists>

2. Rectangle Object
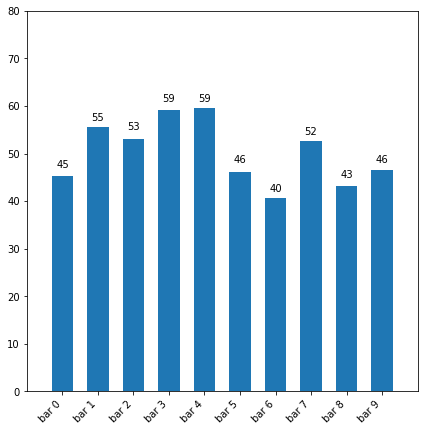
Axes.bar()와 Axes.barh()는 각 막대의 정보가 담긴 BarContainer를 return한다.
Bar Container를 통해 Rectangle object에 접근할 수 있으며 이 object가 막대의 각종 정보를 담고 있다.
Methods
- get_x(): x좌표를 얻는다.
- get_y(): y좌표를 얻는다.
- get_width(): 막대의 width를 얻는다.
- get_height(): 막대의 height를 얻는다.
get을 set으로 바꾸면 값을 설정할 수 있다.
fig,ax = plt.subplots(figsize=(7,7))

n_data = 10
x = np.arange(n_data)
bar_data = np.random.uniform(40,60,(n_data))

ax.set_xlim([-1,10])
ax.set_ylim([0,80])

xtick_labels = ['bar ' + str(i) for i in range(n_data)]
ax.set_xticks(x)
ax.set_xticklabels(xtick_labels,ha='right',rotation=45)

rects = ax.bar(x,bar_data,width=0.6)

for rect in rects:
    x = rect.get_x()
    width = rect.get_width()
    height = int(rect.get_height())
    ax.text(x+width/2,height+2,str(height),ha='center')

Leave a comment