[Matplotlib.pyplot] 05. Scatter Plot
Updated:
import matplotlib.pyplot as plt
import numpy as np
1. scatter
산점도를 그리기 위해서는 scatter 메소드를 이용해야한다.
- x: x좌표
- y: y좌표
- s: size
- c: color
- marker: 산점도에 쓰일 marker 모양
- 다른 parameter는 api reference를 참고
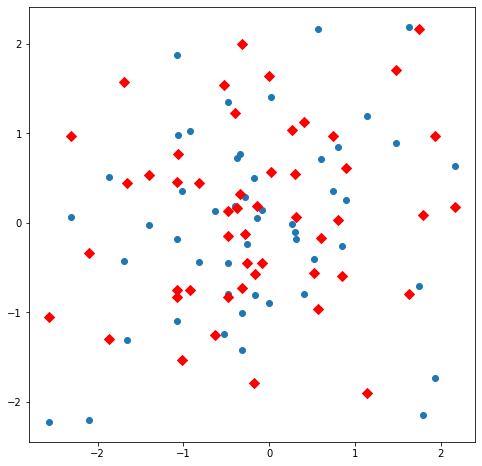
fig,ax = plt.subplots(figsize=(8,8))

x = np.random.randn(50)
y = np.random.randn(50)
y2 = np.random.randn(50)

ax.scatter(x,y)
ax.scatter(x,y2,s=50,c='r',marker='D')
<matplotlib.collections.PathCollection at 0x7f95d91f97f0>
2. line plot과의 차이점
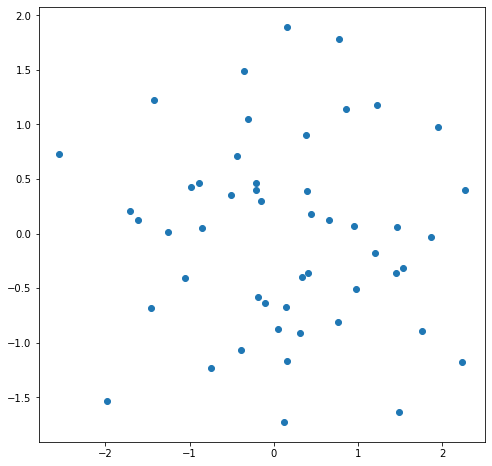
단순하게 따져보면 scatter plot을 이용해 그리는 것은 line plot으로도 할 수 있다.
np.random.seed(0)

fig,ax = plt.subplots(figsize=(8,8))

x = np.random.randn(50)
y = np.random.randn(50)

ax.scatter(x,y)
<matplotlib.collections.PathCollection at 0x7f95da92b250>

np.random.seed(0)

fig,ax = plt.subplots(figsize=(8,8))

x = np.random.randn(50)
y = np.random.randn(50)

ax.plot(x,y,marker='o',linestyle='')
[<matplotlib.lines.Line2D at 0x7f95daaa6c40>]
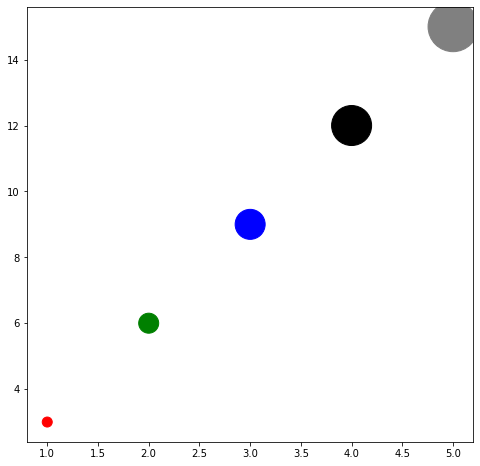
둘의 차이점은 parameter에 array를 넘겨줄 수 있느냐 없느냐이다.
scatter plot은 size,color parameter에 array를 넘겨주어 다양한 크기와 색상으로 표현할 수 있고, line plot은 그게 불가능하다.
fig,ax = plt.subplots(figsize=(8,8))

x = np.arange(1,6,1)
y = 3*x

size_array = np.arange(10,60,10)
color_array = ['r','g','b','k','gray']

ax.scatter(x,y,s=size_array**2,c=color_array)
<matplotlib.collections.PathCollection at 0x7f95dacbc6a0>
Leave a comment