[Matplotlib.pyplot] 04. Line Plot
Updated:
import matplotlib.pyplot as plt
import numpy as np
1. line
1.1. Axes.plot()
matplotlib에서 line을 그릴 때는 Axes.plot()을 이용한다.
Axes.plot()은 line뿐만 아니라 marker만을 이용해 그릴 때도 쓰인다.
- y: 일반적으로 생각하는 (x,y) 중 y를 가리킨다.
- x: 일반적으로 생각하는 (x,y) 중 x를 가리킨다. / x는 꼭 포함하지 않아도 되며 이 때 x축애는 y의 index array가 표시
- fmt: color,marker,linestyle를 합친 문자열 / ‘[color][marker][line]’
- e.g.) color=’r’, marker=’o’, linestyle=”:” -> fmt:’ro:’
- line을 그리기 때문에 Line2D Properties를 만족한다.
- color, marker, linestyle, linewidth, markersize, alpha 같은 parameter를 추가할 수 있다.
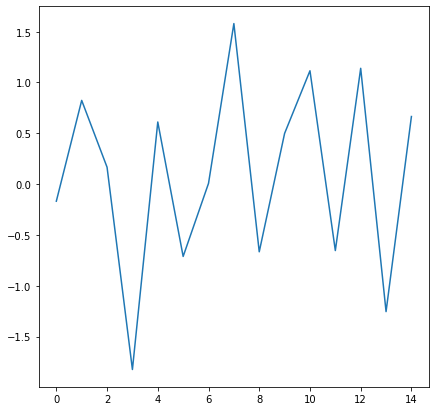
y = np.random.normal(0,1,(15,))

fig,ax = plt.subplots(figsize=(7,7))

ax.plot(y)
[<matplotlib.lines.Line2D at 0x7fe6cc32e970>]
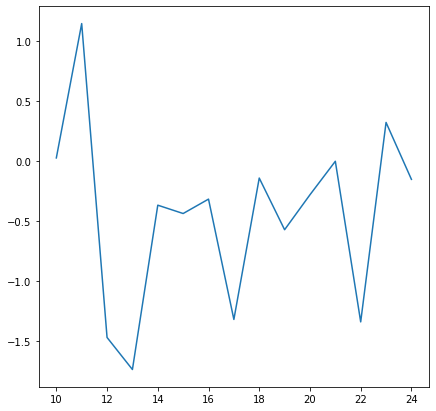
x = np.arange(10,25)
y = np.random.normal(0,1,(15,))

fig,ax = plt.subplots(figsize=(7,7))

ax.plot(x,y)
[<matplotlib.lines.Line2D at 0x7fe6cc5bff40>]
1.2. Axes.axvline(), Axes.axhline()
axes에 vertical line을 그리거나 horizontal line을 그릴 때 사용한다.
Axes.axvline(x=0,ymin=0,ymax=1)
- x: vertical line이 위치할 x좌표
- ymin, ymax: vertical line의 시작위치와 끝위치 표시, 별도 표시가 없는 경우 처음부터 끝까지 그려짐
- Line2D의 특성을 지님
Axes.axhline(y=0,xmin=0,xmax=1)
- y: horizontal line이 위치할 y좌표
- xmin, xmax: horizontal line의 시작위치와 끝위치 표시, 별도 표시가 없는 경우 처음부터 끝까지 그려짐
- Line2D의 특성을 지님
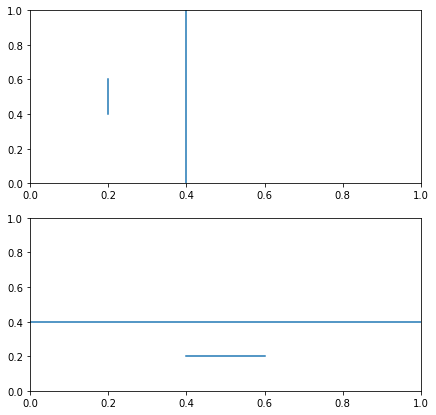
fig,axes = plt.subplots(2,1,figsize=(7,7))

axes[0].axvline(0.4)
axes[0].axvline(0.2,ymin=0.4,ymax=0.6)

axes[1].axhline(0.4)
axes[1].axhline(0.2,xmin=0.4,xmax=0.6)
<matplotlib.lines.Line2D at 0x7fe6cc723af0>
2. Label and Legend
matplotlib에서는 그래프에 나와있는 선이 어떤 선인지 표시할 수 있는 기호 설명표를 달 수 있다. 기호 설명표에 표시하기 위해서는 각각의 plot함수마다 label parameter를 넣어주어야한다.
Axes.legend() Parameter
- loc: legend의 위치. text의 ha와 va랑 비슷하다고 생각하면 된다.
- vertical을 기준으로 하면 upper, center, lower로 나눌 수 있다.
- horizontal을 기준으로 하면 left, center, right로 나눌 수 있다.
- 맨 위 왼쪽(‘upper left’), 맨 위 가운데(‘upper center’), 맨 위 오른쪽(‘upper right’)
- 가운데 왼쪽(‘upper left’), 가운데 오른쪽(‘upper right’)
- 맨 아래 왼쪽(‘lower left’), 맨 아래 가운데(‘lower center’), 맨 아래 오른쪽(‘lower right’)
- bbox_to_anchor: legend가 axes 내에서 어느 위치에 달릴 지 표시하는 2-tuple. text의 x,y postion과 비슷하다.
- x축과 y축을 0 ~ 1까지의 비율로 생각하여 위치 좌표를 표시한다.
- e.g.) (0.5,0): x축 중간, y축 맨 아래에 표시 / (0,1): x축 맨 왼쪽, y축 맨 위에 표시 / (0.5,0.5): x축 중간, y축 중간에 표시
- bbox_to_anchor와 loc의 관계: bbox_to_anchor가 있는 경우 그 지점에 loc를 기준으로 legend가 달리게 된다.
- bbox_to_anchor=(1,0.5), loc=’center left’: x축 맨 오른쪽, y축 중간 지점에 legend의 ‘center left’가 위치함
- ncol: legend가 몇개의 column으로 표시될 것인지 설정
- facecolor: legend의 background color이다.
- title: legend의 제목 표시
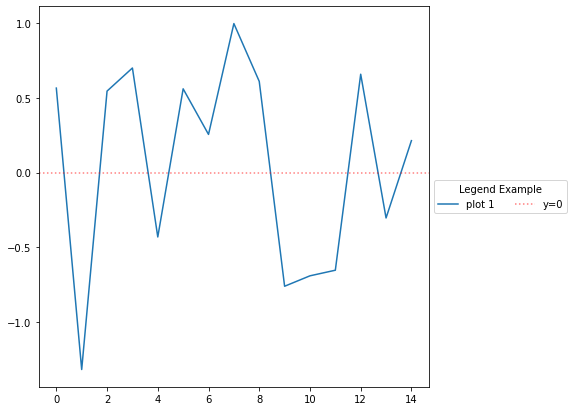
y = np.random.normal(0,1,(15,))

fig,ax = plt.subplots(figsize=(7,7))

ax.plot(y,label='plot 1')
ax.axhline(0,
           color='r',linestyle=":",alpha=0.5,
           label='y=0')

ax.legend(loc='center left',bbox_to_anchor=(1,0.5),
          title="Legend Example",ncol=2)
<matplotlib.legend.Legend at 0x7fe6cc788370>
3. filling the area
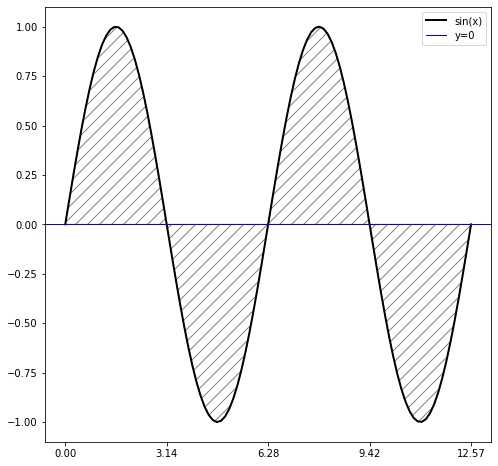
Axes.fill_between(x,y1,y2=0,where=None,interpolate=False) :두 line plot 사이의 영역을 채우는 역할을 한다.
- x: x좌표
- y1: 첫번째 plot
- y2: 두번째 plot / 따로 표시하지 않는 경우 default가 0이다.
- where: 어느쪽 영역이 채워질 것인지 표시하는 것
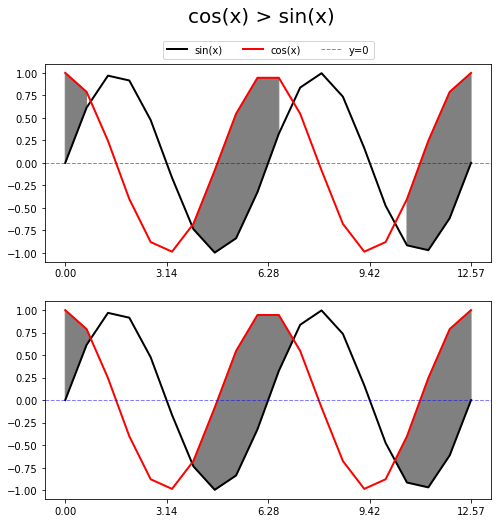
- interpolate: where가 사용되고 두 plot이 교차했을 때 쓰인다.
- 일반적으로 x가 촘촘하지 않은경우 두 plot사이가 완벽히 채워지지 않을 수 있는데 이 때 interpolate=True로 하면 두 plot 사이가 완벽히 채워진다.
fig,ax = plt.subplots(figsize=(8,8))

x = np.linspace(0,4*np.pi,100)
y1 = np.sin(x)

xticks = np.arange(0,5*np.pi,np.pi)
ax.set_xticks(xticks)


ax.plot(x,y1,
        color='k',
        linewidth=2,
        label='sin(x)')

ax.axhline(0,color='b',linewidth=1,
           label='y=0')

ax.fill_between(x,y1,hatch='//',
                color='w',edgecolor='gray')

ax.legend(loc='upper right',bbox_to_anchor=(1,1),fontsize =10)
<matplotlib.legend.Legend at 0x7fe6ccb748b0>
fig,axes = plt.subplots(2,1,figsize=(8,8))

fig.suptitle('cos(x) > sin(x)',fontsize=20)

x = np.linspace(0,4*np.pi,20)
y1 = np.sin(x)
y2 = np.cos(x)

xticks = np.arange(0,5*np.pi,np.pi)

for ax in axes.flat:
    ax.set_xticks(xticks)
    ax.plot(x,y1,
            color='k',
            linewidth=2,
            label='sin(x)')
    ax.plot(x,y2,
            color='r',
            linewidth=2,
            label='cos(x)')
    ax.axhline(0,color='b',linewidth=1,linestyle='--', alpha=0.5,
            label='y=0')

axes[0].fill_between(x,y1,y2,where=y1<y2,
                color='gray')

axes[1].fill_between(x,y1,y2,where=y1<y2,interpolate=True,
                color='gray')

axes[0].legend(loc='lower center',bbox_to_anchor=(0.5,1),ncol=3)
<matplotlib.legend.Legend at 0x7fe6ccbb9e80>
Leave a comment