[Matplotlib.pyplot] 02. Title, Labels, Text
Updated:
import matplotlib.pyplot as plt
import numpy as np
1. Title
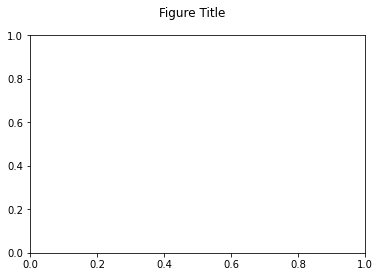
1.1. Figure Title
figure 중앙에 title을 달아놓는다.
plt.suptitle(t,x,y,ha,va,fontsize,fontweight)
- 필수
- t : title로 쓰일 text
- 추가
- x: title이 달릴 x 위치
- y: title이 달릴 y 위치
- ha: horizontal alignment의 약자, ‘center’,’left’,’right’ 중에서 선택할 수 있다.
- va: vertical alignment의 약자, ‘center’, ‘top’, ‘bottom’ 중에서 선택할 수 있다.
- fontsize: font 크기
- fontweight: ‘bold’ 등 글자 두께를 설정할 수 있다.
fig,ax = plt.subplots()

fig.suptitle("Figure Title")
Text(0.5, 0.98, 'Figure Title')
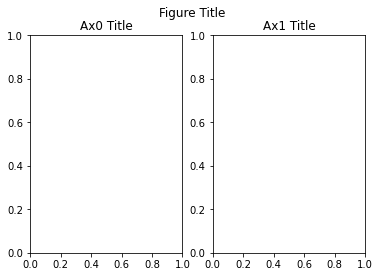
1.2. Axes Title
figure말고 axes 자체에 Title을 설정할 수 있다. 기본적으로 axes 중앙에 title이 달린다.
- label : title로 쓰일 text
fig,axes = plt.subplots(1,2)

fig.suptitle("Figure Title")

for idx, ax in enumerate(axes.flat):
    ax.set_title(f"Ax{idx} Title")
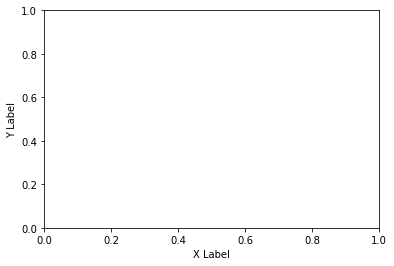
2. Label
axes의 각 축에 label을 설정할 수 있다.
- xlabel: x-axis label로 쓰일 text
- ylabel: y-axis label로 쓰일 text
fig,ax = plt.subplots()

ax.set_xlabel("X Label")
ax.set_ylabel("Y Label")
Text(0, 0.5, 'Y Label')
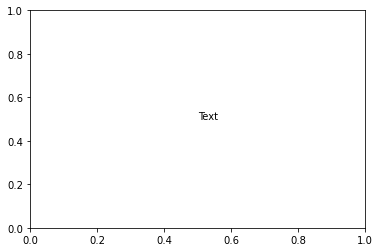
3. Text
Axes에 Text를 표시할 수 있다.
- x, y: text가 놓일 x,y position
- s: text
fig,ax = plt.subplots()

ax.text(0.5,0.5,"Text")
Text(0.5, 0.5, 'Text')
4. Text Properties
Title, Label, Text 모두 text property를 지니고 있기 때문에 parameter로 다양한 text property를 사용할 수 있다.
그 중 몇가지를 소개하면 다음과 같다.
- alpha: 글자의 투명도
- color: 글자 색상
- horizontal alignment, vertical alignment: 수평, 수직 정렬
- family: font 설정
- position: 글자가 있을 (x,y) 위치
- rotation: 글자의 회전
- size or fontsize: 글자 크기
- style or fontstyle: ‘normal’, ‘italic’, ‘oblique’
- weight or fontweight: ‘normal’, ‘bold’, ‘heavy’, ‘light’, ‘ultrabold’, ‘ultralight’
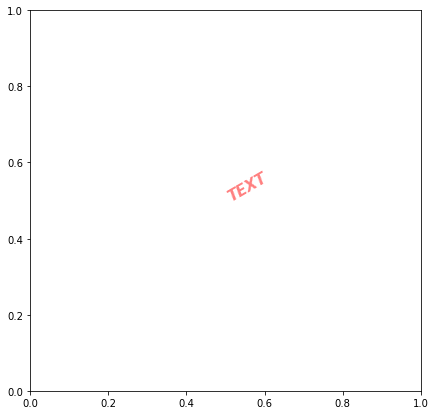
fig,ax = plt.subplots(figsize=(7,7))

ax.text(0.5,0.5,"TEXT",
        alpha=0.5,
        color='r',
        family="sans-serif",
        size= 15,
        rotation=30,
        style="italic",
        weight='bold')
Text(0.5, 0.5, 'TEXT')

설정할 Text가 많아질수록 일일이 설정하기 번거롭기 때문에 text property를 dictionary에 담아 일괄적으로 설정할 수 있다. 이를 font dict라고 하며 다음과 같이 보통 설정한다.
text_dict = {"alpha":0.5, "color":'r', "family":"sans-serif", "size": 15,
             "rotation":30, "style":"italic","weight":'bold'}

fig,ax = plt.subplots(figsize=(7,7))
ax.text(0.5,0.5,"TEXT",fontdict=text_dict)
Text(0.5, 0.5, 'TEXT')
5. Text Alignment
Text를 수평, 수직 정렬을 할 수 있는데 이를 각각 horizontal alignment(ha), vertical alignment(va)로 지칭한다. Text Property를 지닌 대부분이 ha,va를 적용할 수 있다.
- horizontal alignment(ha): ‘center’, ‘right’, ‘left’
- vertical alignment(va): ‘center’, ‘top’, ‘bottom’, ‘baseline’
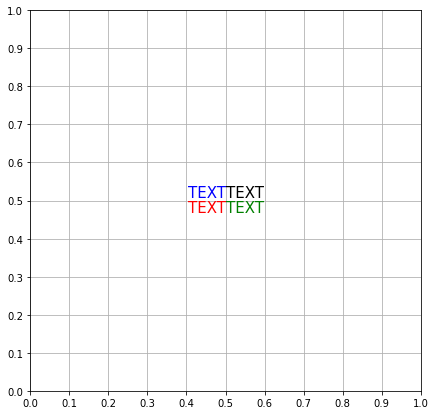
여기서 주의할 점은 수평, 수직 정렬이 text를 기준으로 이루어진다는 점이다. 예를 들어 ha=’left’, va=’bottom’인 경우 text 왼쪽 아래 부분이 정렬의 기준이 된다.
여기서 text alignment는 x, y position과 결합하는 경우가 있는데 이 때 alignment 위치에 x, y position이 자리잡는다.
예를 들어 x= 0.5, y= 0.5라고 하고 ha=’left’, va=’bottom’라 하자. 이 때 text 왼쪽 아래 부분이 0.5,0.5에 위치하게 되고 글자가 (0.5,0.5)를 기준으로 오른쪽 위에 그려지게 된다.
fig, ax = plt.subplots(figsize=(7,7))

## tick 설정
ax.set_xticks(np.arange(0,1.1,0.1))
ax.set_yticks(np.arange(0,1.1,0.1))

## grid
ax.grid()

ax.text(0.5,0.5,"TEXT",
        size=15,
        ha='left',
        va='bottom')

ax.text(0.5,0.5,"TEXT",
        size=15,
        color='r',
        ha='right',
        va='top')

ax.text(0.5,0.5,"TEXT",
        size=15,
        color='g',
        ha='left',
        va='top')

ax.text(0.5,0.5,"TEXT",
        size=15,
        color='b',
        ha='right',
        va='bottom')
Text(0.5, 0.5, 'TEXT')
Leave a comment