[Matplotlib.pyplot] 01. figure, axes
Updated:
import matplotlib.pyplot as plt
1. figure, axes
-
figure: 바탕이 되는 그림판, axes를 그리려면 먼저 figure를 만들어야한다.
-
axes : 좌표축들로 이루어진 그래프를 가리킨다. figure내에 존재한다.
하나의 figure 안에는 여러가지 axes들이 존재할 수 있다.
2. figure 만들기
figure를 만드는 방법은 plt.figure() 메소드를 활용하면 된다.
plt.figure()는 Figure를 만들어 반환한다.
몇가지 parameter를 소개하자면 figsize(figure 크기), facecolor(바탕색)이 있다.
fig = plt.figure()

fig2 = plt.figure(figsize=(5,5),facecolor='linen')
<Figure size 432x288 with 0 Axes>


<Figure size 360x360 with 0 Axes>
3. axes 만들기
3.1.fig.add_subplot()
figure를 먼저 만든 후 사용할 수 있다.
- fig.add_subplot(nrow,ncols,index)
- 전체 figure를 (nrow*ncols)칸으로 구분하여 그 중 index번째 칸을 가리키는 ax를 반환한다. 이 때 ax는 ndarray 형태를 지닌다.
- index는 맨 왼쪽 위부터 1, 그 다음 오른쪽으로 2, … , nrow * ncols 이런식으로 진행된다.
fig = plt.figure(figsize=(5,5),facecolor='linen')

ax1 = fig.add_subplot(2,2,1)
ax2 = fig.add_subplot(2,2,2)
ax3 = fig.add_subplot(2,2,3)
ax4 = fig.add_subplot(2,2,4)
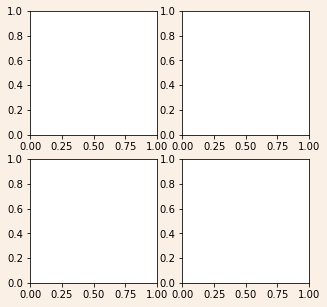
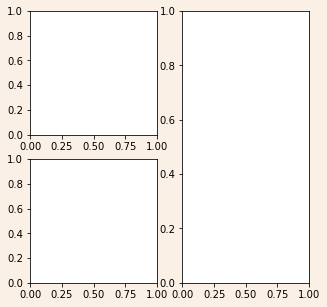
fig = plt.figure(figsize=(5,5),facecolor='linen')

ax1 = fig.add_subplot(2,2,1)
ax2 = fig.add_subplot(2,2,3)
ax3 = fig.add_subplot(1,2,2)
3.2. plt.subplots()
subplots()는 subplots()로 만든 axes와 그 axes를 이루는 figure를 모두 반환하기 때문에 별도의 figure를 먼저 만들지 않아도 사용할 수 있다.
- plt.subplots(nrows,ncols)
- Figure와 axes(총 nrows * ncols 개)를 반환한다.
- 각 ax는 (nrows*ncols)로 이루어진 칸을 가리킨다.
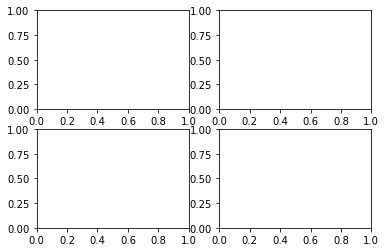
fig, axes = plt.subplots(2,2)

for ax in axes:
    print(ax)
[<AxesSubplot:> <AxesSubplot:>]
[<AxesSubplot:> <AxesSubplot:>]
3.3. plt.subplot2grid()
figure를 먼저 만든 후 사용할 수 있다.
- plt.subplot2grid(shape,loc,rowspan,colspan,fig)
- ax를 반환한다.
- shape : (nrows,ncols)를 가리킨다.
- loc: shape중 몇번째 칸에 있는지 가리킨다. (row,col)로 표현한다. e.g.) 첫번째 행 첫번째 열의 칸: (0,0)
- rowspan : 해당 ax가 행을 얼마나 차지할 지 설정
- colspan: 해당 ax가 열을 얼마나 차지할 지 설정
- fig: 어디 figure에 적용이 되는 지 설정
fig = plt.figure(figsize=(5,5))

ax1 = plt.subplot2grid((2,2),(0,0),fig=fig)
ax2 = plt.subplot2grid((2,2),(1,1),fig=fig)
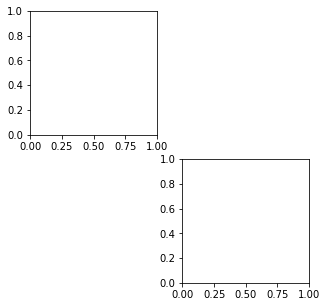
fig = plt.figure(figsize=(5,5))

ax1 = plt.subplot2grid((2,2),(0,0),colspan=2,fig=fig)
ax2 = plt.subplot2grid((2,2),(1,1),fig=fig)
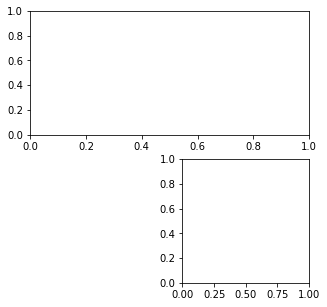
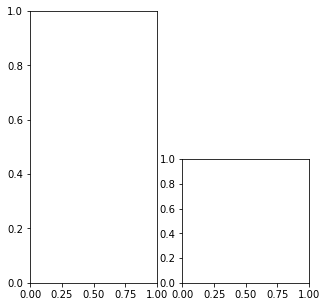
fig = plt.figure(figsize=(5,5))

ax1 = plt.subplot2grid((2,2),(0,0),rowspan=2,fig=fig)
ax2 = plt.subplot2grid((2,2),(1,1),fig=fig)
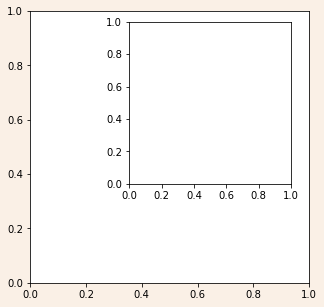
3.4. fig.add_axes()
figure를 먼저 만들고 나서 사용할 수 있다.
- fig.add_axes(rect)
- ax를 반환한다.
- rect: [left, bottom, width, height] 각 요소는 figure width와 height에 대한 비율이다.
- left, bottom : 시작 위치를 가리킨다.
- width, height : 해당 ax의 크기를 가리킨다.
fig = plt.figure(figsize=(5,5),facecolor='linen')

ax1 = fig.add_subplot()
ax2 = fig.add_axes([0.4,0.4,0.45,0.45])
Leave a comment